|
|
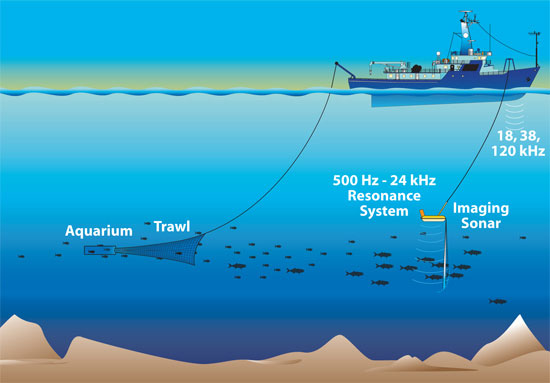
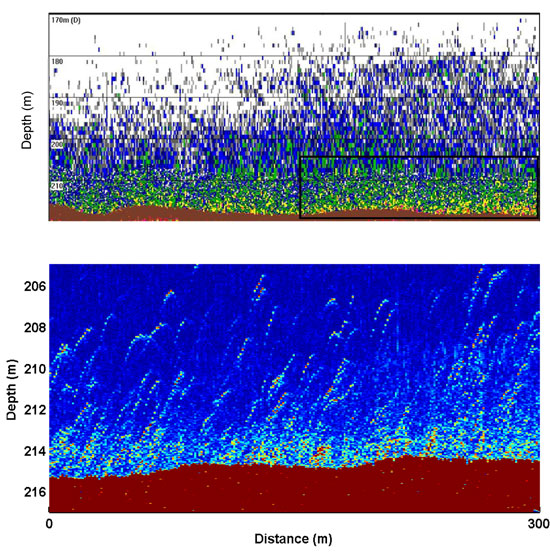
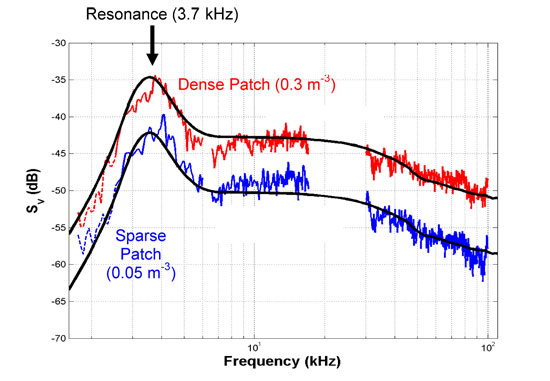
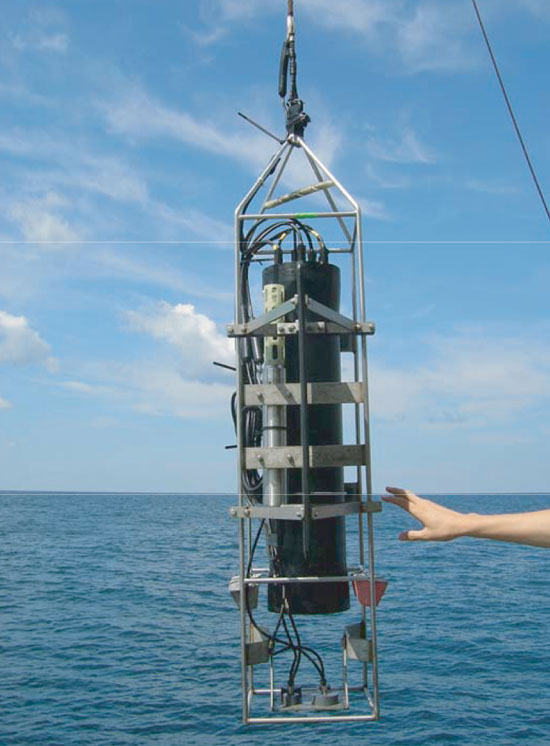
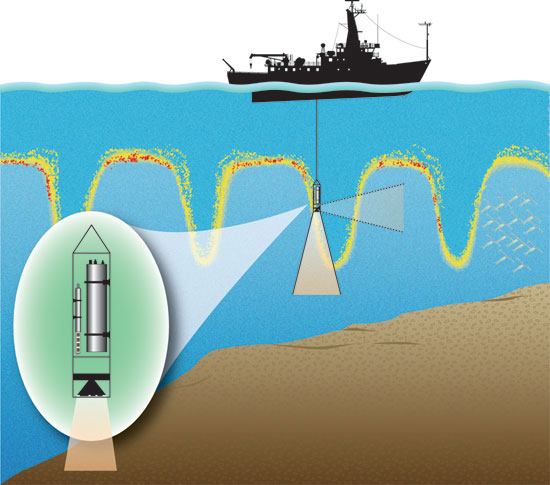
April 1, 2010Source: Media RelationsResearchers at Woods Hole Oceanographic Institution (WHOI) have developed two advanced broadband acoustic systems that they believe could represent the acoustic equivalent of the leap from black-and-white television to high-definition color TV. For oceanographers, this could mean a major upgrade in their ability to count and classify fish and to pinpoint tiny zooplankton amid seas of turbulence. Lead authors Tim Stanton and Andone Lavery in the Department of Applied Ocean Physics and Engineering have already tested the two systems off the east coast of the U.S., with highly promising results. They and their colleagues describe the groundbreaking work in back-to-back papers recently published in the International Council for Exploration of the Sea (ICES) Journal of Marine Science. (Stanton paper; Lavery paper) The technology is the culmination of efforts spanning two decades. Stanton explains, “Components of these advances separately have been achieved by previous investigators, but this is the first of its kind with all of the technologies in one package.” A Problem of Interpretation Because sound quickly travels large distances in water, oceanographers have long recognized the power of acoustic measurements to rapidly survey what lies beneath the ocean surface. When a sound wave hits an object, such as a fish or a shrimp, it scatters. Acoustic scientists analyze the frequency, strength, and timing of the scattered signal to determine what caused the echo. Most acoustic instruments use sound waves that contain only one or a few frequencies. But, interpretation of these echoes is not straightforward. A single frequency sensor used to study two different patches of ocean will probably measure two different echo levels. Those different echo levels might mean the two patches contain different numbers of fish, different sizes of fish, different species of fish, that the fish were oriented differently in the water, or some combination of all of these factors. Stanton emphasizes that these ambiguities can change acoustic estimates of the numbers of fish by orders of magnitude. Interpretation becomes even trickier when using acoustics to study millimeter-to-centimeter-sized animals called zooplankton. Certain types of zooplankton are attracted to places where there are gradients in the temperature and salinity of ocean water. Energy from tides or currents, interacting with rough topographical features of the ocean bottom, such as shelf breaks, result in the generation of turbulence in these stratified locations. Sound waves scattered off turbulence and zooplankton can have similar levels over a range of frequencies, making interpretation of single frequency signals in this frequency range impossible. As Lavery points out, “If you have a region of high turbulence, how do you know if scattering is from turbulence or from zooplankton that have accumulated in the region?” The Broadband Breakthrough If single frequency sensors provide an image of the ocean that is like looking at a black and white television, then Stanton, Lavery, and their colleagues have built acoustic systems that are like viewing high-definition color TV. The new instruments measure sound scattering at, not just a few frequencies, but over a continuous range of frequencies, generating broadband acoustic spectra. Years of theoretical work and laboratory modeling by Stanton, Lavery, and other researchers has laid the groundwork for interpretation of these spectra. Stanton found that, for fish, most of the acoustic action occurs at very low frequencies. Much like blowing across the top of a soda bottle creates a unique tone, low frequency sound waves resonate with air in a fish’s swim bladder creating a characteristic scattering signal. In a broadband spectrum, this signal looks like a peak centered at a frequency between 1 and 10 kHz for small fish. Since most echosounders measure frequencies at 38 or 120 kHz, they miss this key indicator. Importantly, the peak resonance frequency changes for different sized fish, but doesn’t depend on the fish’s orientation in the water. Also, few other marine organisms scatter sound at these low frequencies. All this means broadband signals can be used to not only to discriminate between fish and other marine organisms, but also to identify both sizes and densities of fish. At higher frequencies, the researchers also exploit other aspects of the shape of the acoustic spectrum to determine what scattered the sound wave. For example, a downward slope from 150 to 600 kHz signals high levels of turbulence. In the same frequency range, a curve with an opposite slope, sloping upward, means the water is full of small zooplankton. Further, the frequency at which the shape becomes flat indicates the size of the zooplankton. Not only do the continuous range of frequencies used by broadband systems have the advantage of improving interpretation, they provide a lot more information so Stanton and Lavery can use sophisticated processing algorithms. A method called pulse compression decreases the noise of the signal compared to that of traditional echosounders, increasing the distance at which they can detect the organisms. The same advanced processing also improves range resolution, bringing the acoustic images into sharp focus so closely spaced organisms can be distinguished from each other. These advances will enable scientists to study biological processes, such as predator-prey interactions (that is, determining “who eats who”) with far better accuracy. A crucial element of studying the biological process is to first characterize the temporal and spatial distribution of organisms. The quality of the process study is only as good as the quality of the characterization of the distribution of organisms. If a scientist uses a single frequency acoustic system to study the organisms and misreads a turbulence echo as one from zooplankton, or misreads an echo from a large fish as one from many small fish, then the study of the biological process will be fundamentally flawed. Use of these new broadband systems will greatly facilitate characterizing the distributions of organisms, eliminating many of the ambiguities and improving the accuracy. The Whole Package Stanton and Lavery have incorporated all of these theoretical and processing improvements in two new broadband acoustic systems, and demonstrated their use in the ocean. An instrument spanning lower frequencies (1.5 kHz to 100 kHz) was developed for the detection of fish. Another package that collects measurements at higher frequencies (150 to 600 kHz) was built to discriminate zooplankton from turbulence. Both systems are custom modifications of commercial systems originally designed for studying the seafloor by EdgeTech. The developments were in collaboration with engineers at EdgeTech, who made the hardware modifications. In its first use, the lower frequency package was towed over 1 km patch of Atlantic herring off of Cape Cod, MA where it recorded a consistent resonance peak at about 3.7 kHz. To Stanton and his colleagues this meant that the fish were all the same size (around 24 cm) and that only the density of fish caused differences in the scattering signal. Stanton accurately identified parts of the school where the density was as high as two fish per cubic meter and as low as 0.05 per cubic meter. Lavery and her colleagues first deployed the higher frequency system over the New Jersey continental shelf. In one patch of water, the shape of the broadband spectrum indicated that zooplankton were present. Further analysis showed that these animals were probably copepods -- small crustaceans about 1 to 2 mm in length. In another patch, the distinctive downward slope of the spectrum meant that turbulence, rather than zooplankton, caused the signal. Stanton emphasizes, “That is first of a kind data. Broadband sound has not been used to identify turbulence before.” The Future of Broadband “We aren’t going to stop with these two instruments.” says Stanton. Both researchers plan to develop new broadband systems that span larger ranges of sound frequencies to detect smaller zooplankton and bigger fish. These new packages will be mounted on ships, automatic underwater vehicles (AUVs), and moorings to study a variety of environments over different time and space scales. Beyond the scientific community, broadband technology has important regulatory, commercial, and military value. Classifying and counting marine organisms is fundamental to fisheries managers who need to determine stock sizes. Fishermen benefit from accurate identification of fish sizes and densities, as well as from finding the zooplankton fish eat. The Navy is using broadband technology to learn how fish interfere with underwater systems. Lavery explains, “My hope is that one of the major companies that makes acoustic systems will pick up on broadband technology and make it accessible to the general user community.” Stanton summarizes the accomplishment of twenty years of theoretical, laboratory, and field research as he looks toward the potential of broadband acoustic technology in the ocean, "We have created a body of work. And new milestones are in front of us.” This work was supported by the US Office of Naval Research, National Oceanic and Atmospheric Administration, and WHOI.
The Woods Hole Oceanographic Institution is a private, independent organization in Falmouth, Mass., dedicated to marine research, engineering, and higher education. Established in 1930 on a recommendation from the National Academy of Sciences, its primary mission is to understand the oceans and their interaction with the Earth as a whole, and to communicate a basic understanding of the oceans' role in the changing global environment. Originally published: April 1, 2010 Last updated: June 23, 2011 | |||||||||||||||||||||
|
Copyright ©2007 Woods Hole Oceanographic Institution, All
Rights Reserved, Privacy Policy. |


